Clover Health had its busiest day of trading ever on Friday
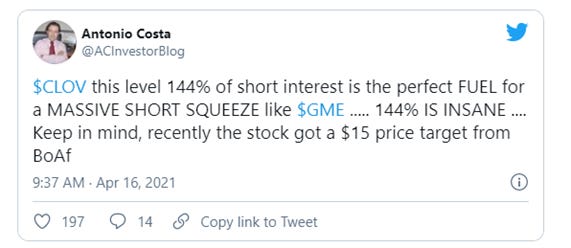
This activity, along with a rise in price, seems to have been triggered by social media posts claiming short interest is over 140% of the float, with the potential for a GameStop-like squeeze
Closer scrutiny of the float and share dynamics show this view is misplaced
“Get your facts first, then you can distort them as you please.”
- Mark Twain
Shares in Clover Health Investments, Corp. (NASDAQ: CLOV) rallied 35% on Friday, April 16, before pulling back to close up 20%. What started as a mundane trading day, with shares opening at $7.40 and trading down modestly to $7.23 in the first 20 minutes of trading.
Things changed very quickly following a raft of posts on social media claiming that CLOV has a short interest equivalent to 144% of its public float. Most people are aware of the GameStop short squeeze in January of 2021 on the back of a 140% short interest combined with a social media frenzy.
The ball seems to have started rolling on Thursday night with a Bezinga article titled “8 Stocks With The Highest Short Percent Of Float”, and top of the list, quoting data from data analytics firm S3 Partners, was Clover Health at 144.7%, and Bezinga Staff Writer Wayne Duggan didn’t hold back drawing the parallel to GameStop:
Source: Benzinga
After the match was lit and this “fact” began circulating, social media erupted with a “the next GameStop” narrative. Below is but a small sample:
Even Bill Hwang was getting in on the action, although I suspect this might be a parody account:
Benzinga piled on again later on Friday morning, again touting the S3 data.
The chart below shows the daily trading volume of CLOV from inception, including its days a pre-merger SPAC:
Prior to Friday, CLOV had an average daily trading volume of 5.8 million shares (based on a Bloomberg 15-day simple moving average). On Friday over 249 million shares traded hands.
The chart below shows the trading price through the day:
As the wildfire spread, it was picked up by other news outlets that kept repeating the S3 data, for example in this Bloomberg article below:
As some people began to question S3’s data and where the supposed 144% figure came from, S3 tweeted out that it uses FactSet to supply float data for “its algorithms”. The tweet is shown below:
The feedback loop through wallstreetbets and other venues continued:
Few seemed to care that the 26.26 million share number used for the float seems incredibly low on its face, particularly as a single shareholder (index fund Vanguard Group) owns 26.2 million shares just itself:
S3 doubled down on the 26.3 million float figure, claiming that the CEO’s 83.6 million shares are not tradable, and thus not in the float number:
This is a very odd assertion, particularly given CEO Vivek Garipalli’s 83.6 million shares are non-tradable CLASS B shares, not the Class A shares which are the listed and traded shares, and thus never included in any Class A shares outstanding number to begin with:
S3 Managing Director Ihor Dusaniwsky tripled down on the 26.3 million number late in Friday’s trading session, claiming that FactSet is “standing behind” the figure.
Mr. Dusaniwsky also repeated the “CEO’s shares” narrative:
Over the weekend, reports have come in that FactSet has updated its figures and now reports a 35.1% short interest on a float of 109.9 million shares. While I don’t have access to FactSet, it does feed public news sources and the reports on Twitter that FactSet has corrected its figures seem confirmed, as shown on the MarketWatch website which confirms FactSet is its data provider:
Despite this change, it appears that confirmation bias has gripped many investors over the weekend, triggering fierce debate and accusations against “shorts”. A very popular r/wallstreetbets post on Reddit labels more accusations and attempts to “prove” based on source documents that, while not 144%, the short interest as a percentage of the float is still a blistering 118%, along with calls to fellow “degenerates” to buy more call options to “introduce some gamma fairy dust so that MMs have to hedge with more shares, making the shorts cover” and such:
Source: www.reddit.com/r/wallstreetbets/comments/msnkc1/the_lucky_clover/?utm_source=share&utm_medium=ios_app&utm_name=iossmf
The post sourced above has been upvoted 1,400 times and counting and has already attracted 568 comments.
So, what the heck is going on? Let’s get to the bottom of this together, shall we?
First, let’s back up and ask what a “public float” is, for those that may be unfamiliar. While some methodologies differ, we’ll go with the Wikipedia definition which is decent enough:
“In the context of stock markets, the public float or free float represents the portion of shares of a corporation that are in the hands of public investors as opposed to locked-in shares held by promoters, company officers, controlling-interest investors, or governments.”
Before we get to our own calculation of float, first let’s torpedo the analysis provided in the Reddit table below, and which is still being heavily circulated on Sunday as proof of 118% short interest.
To help in our analysis, let’s get a little crazy, I mean really really crazy, and pull up the Clover Health 10-K ourselves, which can be found here.
First, let’s look at the very first page, which shows that as of March 24, 2021, there were 145,345,832 Class A Common shares outstanding:
This is the same number used in the Reddit post, and given it’s right there in the 10-K, is not disputed by thinking humans. Note the 10-K also references 260,969,355 Class B Common shares, but those are not traded securities and are rightly excluded from “public float”.
Now let’s go to page 102 of the Clover Health 10-K which conveniently provides a table of all shares owned by 5%+ holders, and all executive officers and directors:
I have to apologize as I know this feels like work, and investing shouldn’t require work, right? Anyway, let’s point out a few things from the table above.
First, it’s important to understand footnotes in any document, especially SEC filings. Keen readers will recognize that the source data in the Reddit post matches many of the numbers in this 10-K table. However, the author made several massive errors. I know, massive errors, on Reddit of all places. I’m as shocked as you are.
Error #1 – Double Counting Chamath Palihapitiya’s shares
The 10-K table shows shareholders that own 5% or more in one section, and shows shares held by officers and directors in the second section. However, it’s possible to appear in both sections. Indeed, Chamath was a director as at the time of the 10-K (he and Ian Osborne resigned upon completion of the SPAC merger), but also beneficially owns entities that own over 5%, so appears in both sections. These are the same shares so should not be double counted. The Reddit poster correctly shows 20,500,000 shares held by SCH Sponsor III LLC, and 10,000,000 shares held by ChaChaCha SPAC C LLC. Note 1 confirms that Chamath, along with Ian Osborne, control SCH Sponsor III, and Note 2 confirms Chamath controls and beneficially owns “ChaChaCha”. Via the wonders of Grade 2 mathematics, we know that 20,500,000 + 10,000,000 = 30,500,000, which matches what is shown for him personally.
If you still don’t believe me, please see Note 3 to the table above, the footnote tagged to Chamath personally (reminder, we are always excluding the non-traded Class B shares from our float calcs:
Error # 2 – Double Counting Ian Osborne’s shares
Along the same lines as Error #1, we can see that Ian Osborne appears in both sections, as he was both a director as of December 31, and also a 5%+ shareholder. Please read note 4:
Those with a keen eye will quickly pick up on the 20,500,000 Class A common shares owned by SCH Sponsor III LLC, as already being included in Chamath’s holdings, as both Chamath and Mr. Osborne share ownership and control of SCH Sponsor III, per note 1:
Despite those shares already being associated with Chamath in the Reddit user’s table, the user erroneously counts them a second time as shares to be removed from the float. Only the 5,000,000 shares owned by Hedosophia Public Investments Limited should rightly be included, as those shares are not associated (and thus haven’t been included) with other shareholders or officers and directors.
Error # 3 – Excluding Vanguard’s shares from the public float
Vanguard is a large mutual fund and ETF company. It owns freely trading Class A shares that can be bought or sold at any time. As such they should not be excluded from the public float. However, I do have some sympathy as to why someone might consider Vanguard’s ownership less likely to buy and sell as a passive indexing company (other than the usual flow related buys and sells and periodic index rebalancing). So, while these shares are definitely in the public float by any technical definition, I’ll provide some analysis both including and excluding these shares. You’re just going to have to use your own judgement on the matter.
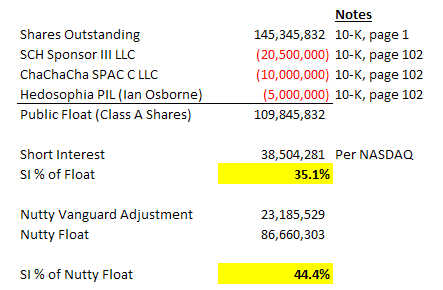
Adjusting for these two major errors, plus another technical error (re: Vanguard), we get a short interest as a percentage of the public float of between 35% on the low end, and 46% on the high end if one were to back out Vanguard for a wonky unorthodox float calculation:
Please note the short interest of 38,504,281 is reported every two weeks and is available from NASDAQ, and the number, while a couple of weeks stale, is not in dispute:
Source: https://www.nasdaq.com/market-activity/stocks/clov/short-interest
Now that we know how may shares everyone owns and through which entities, we can make a simple calculation on what the actual public float is. If for some reason someone wants to look at these calcs excluding Vanguard (let’s call this a Nutty Vanguard-Adjusted Float, or “NVAF”), I’ve included that as well in the table below:
Based on the foregoing, we can easily calculate that the short interest as a % of the actual float (Using March 31 short interest) is actually around 35%. And if for some reason someone wants to treat Vanguard like a locked-up insider, it’s around 44%. Still elevated, but nowhere close to 118% let alone 144%. GameStop this is not.
There are other things we can look at to consider if CLOV is a great way to burn “the suits” and squeeze them to the moon or wherever. First, with average volume of 11.7M daily shares prior to Friday’s frenzy, it would take roughly 3.3 days to cover (at 100% daily volume). At 1/3 of daily volume, we’re looking at perhaps 10 days. Up there, but not crazy. The entire short interest is equivalent to only 15.4% of Friday’s frenzied volume.
It’s also worth pointing out that, while not factoring into the technical definition of “float” there are an additional 38,504,281 long positions out there in client accounts representing shares that have been lent out to short sellers and sold. That’s a topic for another day but I touched on it in a Twitter thread that can be found here.
Also note that none of this has anything whatsoever to do with the fundamentals of the company. Who cares why the short interest is so high, amirite?
I have no idea if CLOV will go up or down, but hopefully this article will help people make an informed “investing” decisions.
“Facts do not cease to exist because they are ignored.”
- Aldous Huxley


I should also mention, I have never traded $CLOV and have no position of any kind here.
Vanguard lends its shares to short sellers to enhance returns. They’re very much freely traded and should be included in the float calculation.