Baggy Mythbusters Episode 1: Misunderstood and Misused - "Daily Short Volume"
Enough is enough.
“The truth is more important than the facts” - Frank Lloyd Wright
How many times have you seen something like the below exchange play out on social media (e.g. Twitter or its lowbrow bastard child Stocktwits)?
If I had a Dogecoin for every time I read a post about “daily short volume”, I’d have a lot of worthless Dogecoin. While it would be easy (and quite accurate) to dismiss those that toss it around as drooling nincompoops, it is also a topic that is not well understood by many normal investors.
FINRA Short Interest vs. Short Volume
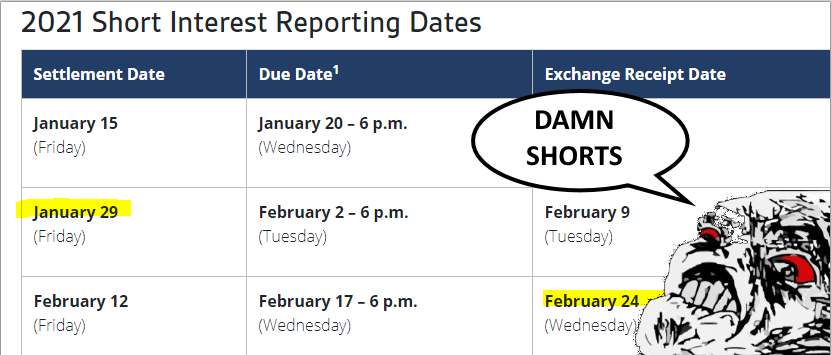
The Financial Industry Regulatory Authority (FINRA) is the self-regulatory agency that is responsible for regulating U.S. member brokerage firms and exchanges (someone’s gotta do it, amirite SEC?). FINRA requires all member firms to report short interest positions twice per month, for all customer accounts as well as any proprietary accounts. These are generally released with a 7-9 business day lag following each mid-month and month-end period. See here for FINRA’s current release schedule.
Given this modest time lag, combined with the fact that the reports are on a settlement date (trade date + 2 day) basis, they are a bit stale. When released they are about two weeks past the last trade date period, and by the time the next report is issued they can be almost month old. For example in the FINRA schedule below, the January 29 report was released on February 9, and the next report was not released until February 24, meaning the data is always about 2-4 weeks stale.
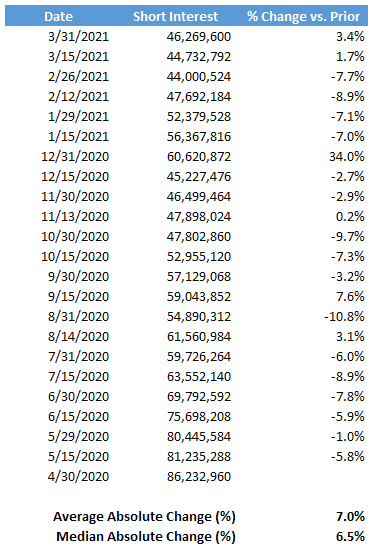
Is that a big deal? In reality not really. Massive changes in short interest are rare over such time period, absent a major event or catalyst. For example Tesla, a “battleground stonk” if there ever was one, had an average change of +/- 7% over the past year of data on 23 observations with only one outsized move of 34% which coincided with the company’s addition to the S&P 500 Index.
Given in almost all cases the short interest is well below the shares outstanding and the public float (that’s right, $CLOV nutbars), these moves are generally not material to the trading dynamics of a particular equity. As such they represent the best and most accurate estimate of current short interest based on public information. Some firms that I won’t name (because one of them is clownish and I don’t want to advertise for them) provide proprietary estimates in between these reporting periods can provide a smoother estimate in between the actual reporting dates.
However, despite these generally modest changes in short interest every couple of weeks, hordes of uniformed and oft-unhinged loons have latched on to another piece of data pinched out by FINRA, the “Daily Short Sale Volume”. Some background is in order.
Everyone knows that short sellers are to blame for the 2008/2009 global financial crisis (or “GFC”, if you own a Patagonia vest). Shorts forced lenders to extend mortgages to borrowers with horrible credit ratings. Shorts forced Dick Fuld to lever up Lehman Brothers 44:1. Shorts forced people to buy homes and take out mortgages they couldn’t make payment on. Shorts forced the credit rating agencies to slap AAA ratings on pure rubbish.
Naturally, the porn-addicted SEC was facing intense pressure to “do something” after the GFC, and in July 2009 released a series of measures to “curtail abusive short sales and increase market transparency”. One of the measures to “increase transparency around short sales” was to request that FINRA publishes aggregate “short selling volume in each individual equity security for that day." FINRA has dutifully complied and the daily short sale files have been published for years (see here).
There’s nothing wrong with transparency. However, unless you are Boeing, if you’re going to unleash something onto the public it should come with an instruction manual to prevent its misuse and abuse.
For a full decade, as more and more retail investors “discovered” this data, it fueled an ever-increasing cacophony of paranoid retail investors looking at seemingly massive daily “short sales”, and have generally convinced themselves that each tick is an epic struggle between “true longs” and “desperate” shorts trying to hold their beachball underwater.
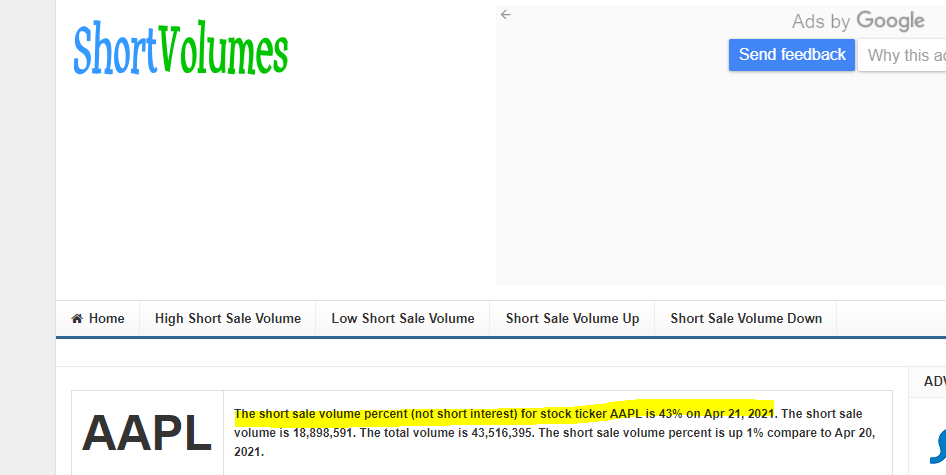
It has even spawned a cottage industry of websites that merely take the free data file from FINRA and put it on a website to generate ad traffic. For example “shortvolumes.com”. Dig it:
OMG, the desperate shorts are holding down Apple with 43% of the volume being short sales. Let’s just think about that for a second. 43.5 million shares traded, and 18.9 million shares are “short sales”. At about $133 per per share, that is $2.5 BILLION. For a single day, in one stock. Hmmm.
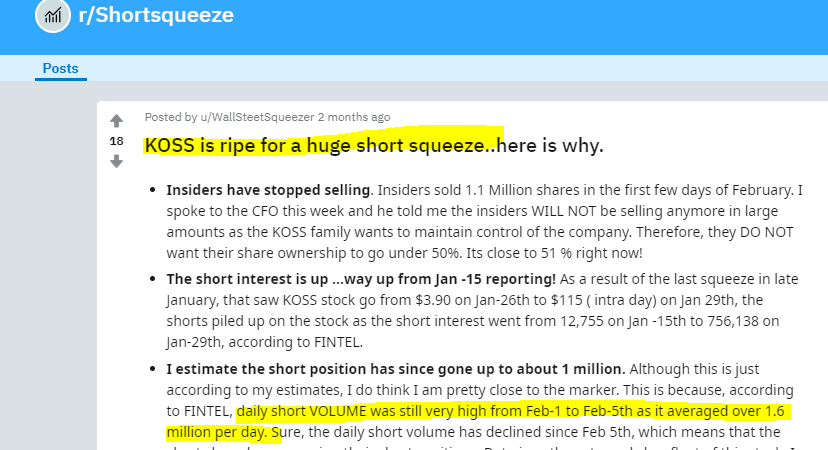
Search “daily short volume” on Reddit and you’ll see that baggies are all over this:
Thanks for clarifying that is not financial advice. Let’s check out the clown car over at r/Shortsqueeze for more:
Ok just one more so we can completely lose faith in humanity:
It seems few of these people have ever asked the question as to why, with some massive daily short volumes (e.g. 20% to 77% in our random nut sample above), the changes between each semi-monthly short interest report from FINRA is not that great.
In our Tesla example above, for the period from March 15 to March 31, daily short volume adds up to almost 140 million shares. Isn’t it strange then, that the short interest change from March 15 to March 31 was only an increase of 1.5 million shares? Just over 1% of the cumulative daily short interest. Surely something else is going on here. And it’s not either of these things:
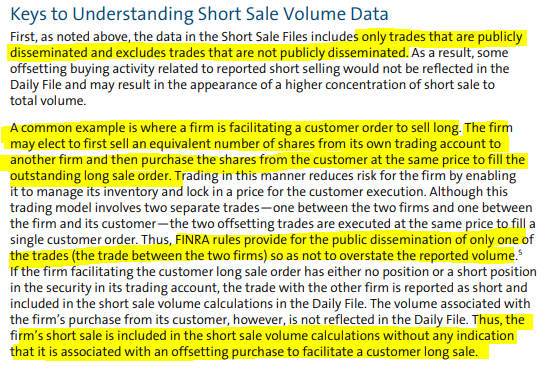
So after all of that preamble, what the heck is going on here? The reality is that most of the daily short volume that is reported has nothing do do with short sellers. Most of this volume, in reality, is merely the execution of sell orders on behalf of holders of long positions. Here is the sequence (in simplified form, we don’t need to go down a Citadel rathole):
Step 1 - Shareholder places a sell order through his or her broker.
Step 2 - Broker “shorts” into the market.
Step 3 - Broker “covers” the short by buying from client at the trade price.
Per FINRA rules, only the “on-exchange” transaction gets reported. In the case above this is the “short sale” in Step 2 above, but in fact it is just the broker executing a transaction on a riskless basis.
It took FINRA a full decade to finally, in 2019, publish a 4-page guide to understanding short sale volume date. It can be found here. But by then it was really way too late, and most attempts to explain reality to baggies results in being blocked and/or accused of being a desperate shorty FUDster, often accompanied by one of these:
There’s no coming back from that.
Below is a key section from the FINRA notice that attempts to explain what is going on here, although the full notice is worth a read:
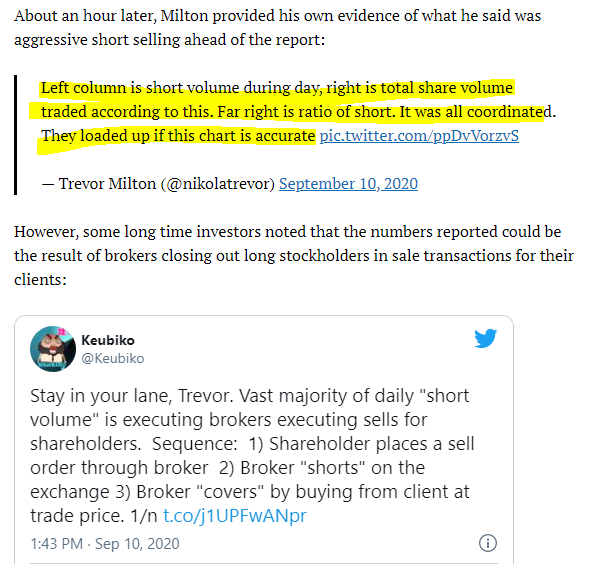
Misuse of this data isn’t confined to retail investors. In September 2020, Nikola Motors founder Trevor Milton lashed out at short seller using this data as evidence that “it was all coordinated”. His Twitter account is gone but an article covering this (including my sassy reply) can be found here. Note the ominous use of “They”. They are always out there, looking to snatch your cheapies.
“When in doubt, tell the truth.” - Mark Twain








Your feeble attempt to trivialize the Manichaean struggle between shorts and longs is noted.
Put wang in Vitamix to atone for your sins.
I can tell this is a shill piece because you neglected to mention that FINRA does not post non-member or offshore shorting volume. Member firms often move their shorts offshores. Disingenuous and unprofessional as always Keubiko.